
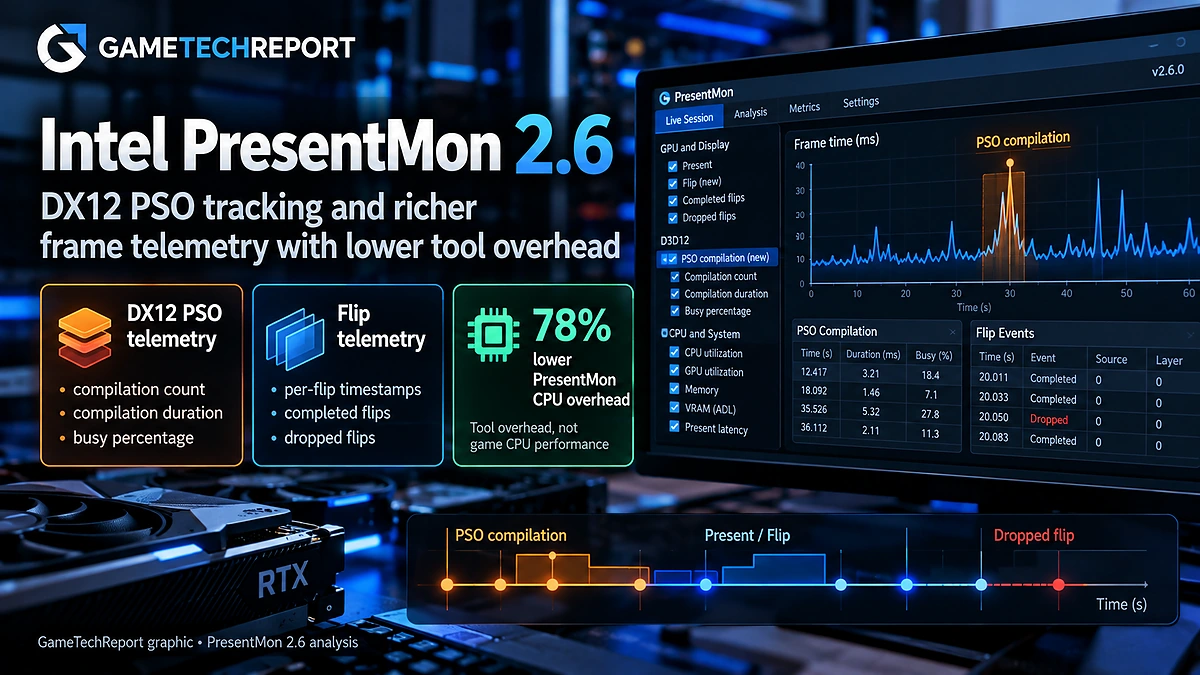
Intel PresentMon 2.6 can now record DirectX 12 pipeline state object compilation inside frame and CSV captures. The new data includes PSO compilation count, duration and busy percentage, giving performance captures another signal to compare with frame-time spikes.
The release also reduces PresentMon’s own CPU overhead. Intel reports a 78% reduction under load, but its release notes do not give the absolute active CPU usage before and after the change or describe the test platform used for that figure. The number therefore describes a reduction in the monitoring tool’s overhead, not a game-performance gain.
PresentMon 2.6 records PSO work inside frame captures
PresentMon tracks Direct3D 12 pipeline state object compilation through ETW and attributes the activity to frame and CSV capture data. Its current API exposes three dedicated metrics: PM_METRIC_PSO_COMPILE_COUNT, PM_METRIC_PSO_COMPILE_TIME and PM_METRIC_PSO_COMPILE_BUSY_PERCENT.
For a reviewer or developer, that makes a frame-time spike easier to investigate. A capture can show whether PSO work occurred in the same measured interval instead of leaving pipeline compilation as an assumption based only on the hitch.
GTR analysis: PSO activity and a frame-time spike occurring together still do not prove that pipeline compilation caused the entire hitch. Asset streaming, CPU game logic, storage activity or driver work may overlap the same frame.
| Data | PresentMon 2.6 adds | Useful interpretation |
|---|---|---|
| PSO compilation | Count, duration and busy percentage | Whether D3D12 PSO work coincided with a frame-time problem |
| Flip events | Per-flip timing, completed/dropped status and source/layer IDs | More context for what happened between presentation and display |
| Telemetry polling | Per-metric provider granularity | Clients can request only the telemetry endpoints needed for the selected metrics |
Intel’s 78% CPU figure describes PresentMon, not the game
Intel attributes the reduction to changes in ETW flush handling and related loops, which now use coarser Sleep-based waiting where precise timing is unnecessary. The company says this reduces PresentMon CPU use under load by 78%, including on mobile-class systems.
Idle diagnostic log flushing was also changed. When the service is not actively tracking or polling telemetry, the reported CPU cost falls from 0.003% to 0.000%.
The active-load figure is less complete. The v2.6 release notes give the relative reduction, but not the absolute starting and ending CPU percentages, the processor used, the measured application, the active metric set or the duration of the run.
GTR analysis: Intel reports that PresentMon itself is doing less CPU work. The published data is not enough to calculate how much that changes FPS, frame-time variance or benchmark error on a particular system.
Flip IDs and selective telemetry polling add more capture context
PresentMon 2.6 also tracks newer Windows OS DDI flip events with per-flip timestamps and completed or dropped status. CSV output can include source ID and layer ID, which Intel says makes multi-plane and multi-display scenarios easier to analyze.
Per-metric providers also let PresentMon poll only the telemetry needed by the metrics a client requests, while ADL, NVAPI/NVML, IGCL and WMI feed the same dynamic provider model.
That matters outside the overlay because Intel also documents PresentMon for command-line batch testing and automation. The project supports Intel, AMD and NVIDIA hardware across several graphics APIs, although the new PSO compilation metrics themselves are specifically for DirectX 12.
PSO metrics can narrow a stutter investigation without proving the cause
- PSO activity is evidence, not a verdict. A matching timestamp strengthens the case for further investigation but does not exclude other work happening in the same frame.
- The PSO metrics are D3D12-specific. They should not be generalized to shader compilation in DirectX 11, Vulkan or OpenGL titles.
- The release notes do not publish an absolute active-overhead baseline. They cannot tell us how much a specific benchmark result changes.
We used the same distinction between measured data and broader conclusions in our DLSS 5 performance analysis.
Measuring the 78% overhead claim still needs an A/B test
A useful independent test would compare PresentMon 2.5.1 and 2.6.0 on the same machine, with the same game scene and identical capture configuration. PresentMon service CPU time, frame-time distribution and run-to-run variance could then be compared directly.
For the PSO metrics, a reproducible DirectX 12 scene could be recorded cold and then repeated after the relevant pipeline state has been encountered. If PSO activity and the same frame-time spike both change between runs, that would provide stronger evidence than a single capture.
GameTechReport has not run those tests. For now, the published material supports two conclusions: PresentMon 2.6 captures more D3D12 pipeline and presentation data, and Intel reports lower CPU overhead in the service. How much either change affects a real benchmark still requires controlled testing.
Primary sources: Intel/GameTechDev PresentMon v2.6.0 release notes; PresentMon API header; Intel PresentMon product page. Analysis and test methodology: GameTechReport.